

WMZERO – Real-Time Electromagnetic Wave Visualization Software
Powerful EMC pre-compliance analysis — affordable, flexible, and easy to use.
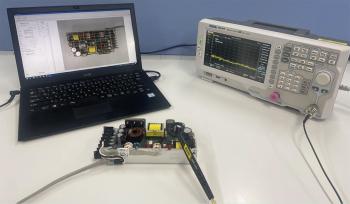
WMZERO transforms your existing spectrum analyzer into a real-time EMI visualization system, empowering engineers to identify noise sources and analyze electromagnetic interference quickly and intuitively.
Key Description
WMZERO is a software-based EMC visualization tool designed for engineers in R&D, quality control, and production environments who need rapid, visual insight into electromagnetic noise behavior. By running on a standard Windows PC and connecting to a compatible spectrum analyzer, WMZERO delivers clear, color-mapped visuals of electromagnetic wave intensity distribution — bridging the gap between raw measurement data and actionable insight.


Core Features
📊 Intuitive Real-Time Visualization
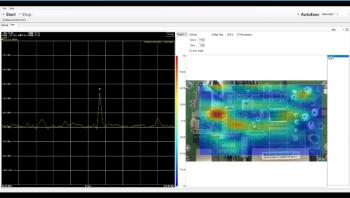
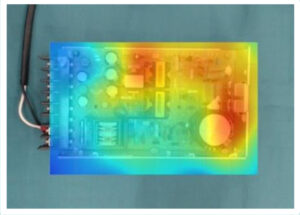
Visualize electromagnetic wave (noise) intensity as a full-color heat map in real time.
Displays noise distribution spatially over the device under test for immediate insight.
🔬 Easy Operation with Minimal Setup
Simply install software on your PC and connect your spectrum analyzer — no complex configurations or additional hardware required.
Manual scanning is straightforward, enabling hands-on diagnostics without steep learning curves.
💡 Cost-Efficient Solution
Uses your existing measurement hardware (spectrum analyzer & probes) to reduce initial investment costs.
Software licensing allows rapid deployment and upgrades.
📍 Noise Source Identification
Visual representation highlights intensity hotspots and frequency components, helping isolate interference sources.
Suitable for troubleshooting, design validation, and EMI pre-compliance checks.
🛠 Flexible Application
Ideal for on-site measurements in lab, production, or inspection settings.
Supports a variety of spectrum analyzers from multiple manufacturers.
Specifications
| Specification | Details |
|---|---|
| Product Type | EMC / EMI Visualization Software |
| Function | Real-time electromagnetic wave and noise distribution visualization |
| Compatible Measurement Devices | Spectrum analyzers from multiple manufacturers* |
| Operating System | Windows 10 / Windows 11 |
| Visualization Output | Color-mapped intensity display (heat map) |
| Measurement Method | Manual scanning using connected spectrum analyzer and probes |
| Data Display | Frequency-based and spatial noise visualization |
| Installation | PC-based software installation |
| Licensing | Software license (subscription-based) |
*Supported spectrum analyzers and interfaces vary by manufacturer. Please contact us for compatibility details.
Typical Use Cases
✔ EMI debugging in R&D labs
✔ EMI pre-compliance measurement
✔ Quality control inspection and production validation
✔ Design verification for EMC mitigation
Documents


Manufacturer

Los Angeles
21241 S. Western Ave. Suite 140
Torrance, GA 90501
United States
Request for Quote
At Seika, we provide custom quotes tailored to meet your exact specifications, ensuring high-quality and reliable solutions for your manufacturing and industrial needs.
Related Products
At Seika, we provide custom quotes tailored to meet your exact specifications, ensuring high-quality and reliable solutions for your manufacturing and industrial needs.